BC Beer Sales Show Continued Multi-Year Decline in 2025 Data
Data to Sep 30, 2025 shows continuing downward trend in recent years
news
analysis
Highlights
- BC beer sales show a persistent multi-year contraction through September 2025.
- Litre declines exceed revenue declines, implying price increases are masking deeper volume weakness.
- The downturn is concentrated in BC-produced beer, which represents the majority of provincial sales.
- 2025 shows a slower rate of decline than 2024, though sales remain materially below prior years.
Beer sales in British Columbia continue to trend downward, with volumes declining faster than revenues. Updated data through September 30, 2025 shows that both net dollar sales and litres sold remain below levels seen in recent years, extending a multi-year pattern of contraction in the provincial beer market.
This analysis draws on data published by the BC Liquor Distribution Board in its latest quarterly Liquor Market Review, using the interactive dashboards on BCBeer.ca. To ensure consistent comparisons, results focus on the first nine months of each year (Jan thru Sep), allowing 2025 performance to be evaluated against prior periods on a like-for-like basis.
While the pace of decline has moderated somewhat compared to 2024, the overall direction remains negative. The data highlights three key dynamics: a steady multi-year decline in beer sales overall, even sharper reductions in volume than in dollar value (being offset by rising prices), and disproportionate role of declines in BC-produced beer, which accounts for the majority of beer sold in the province.
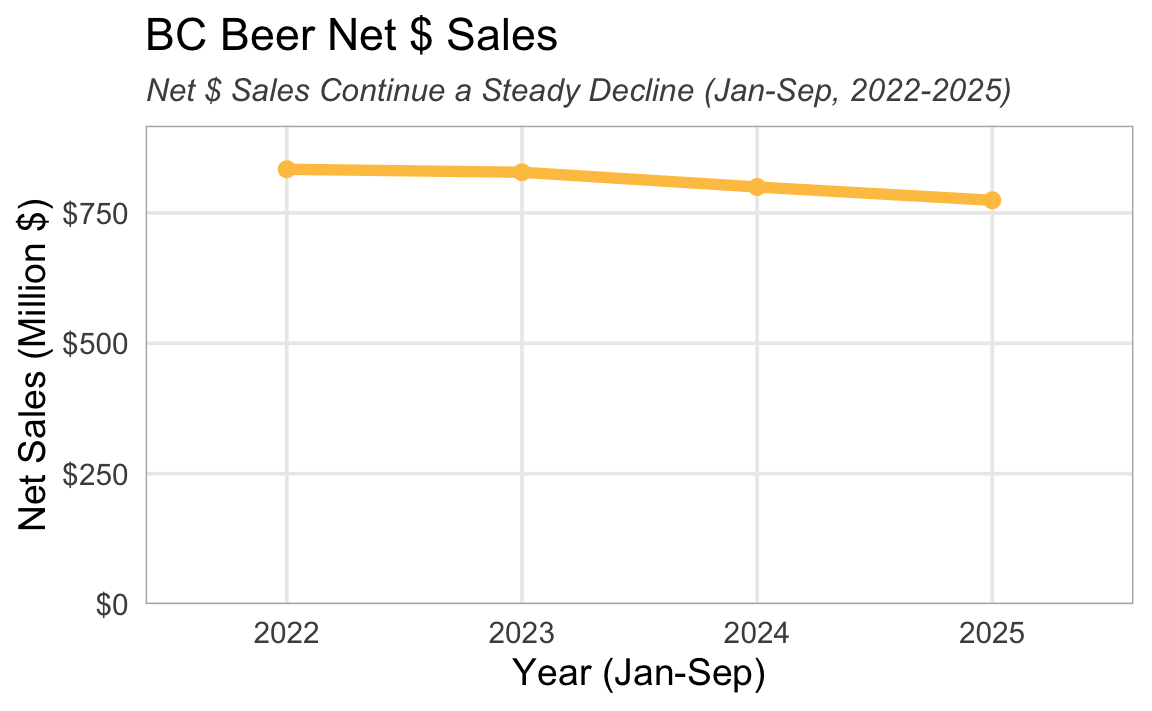
Steady Multi-Year Decline in BC Beer Sales
Comparing Jan-Sep of each year since 2022, the decline is not steep, but it is steady.
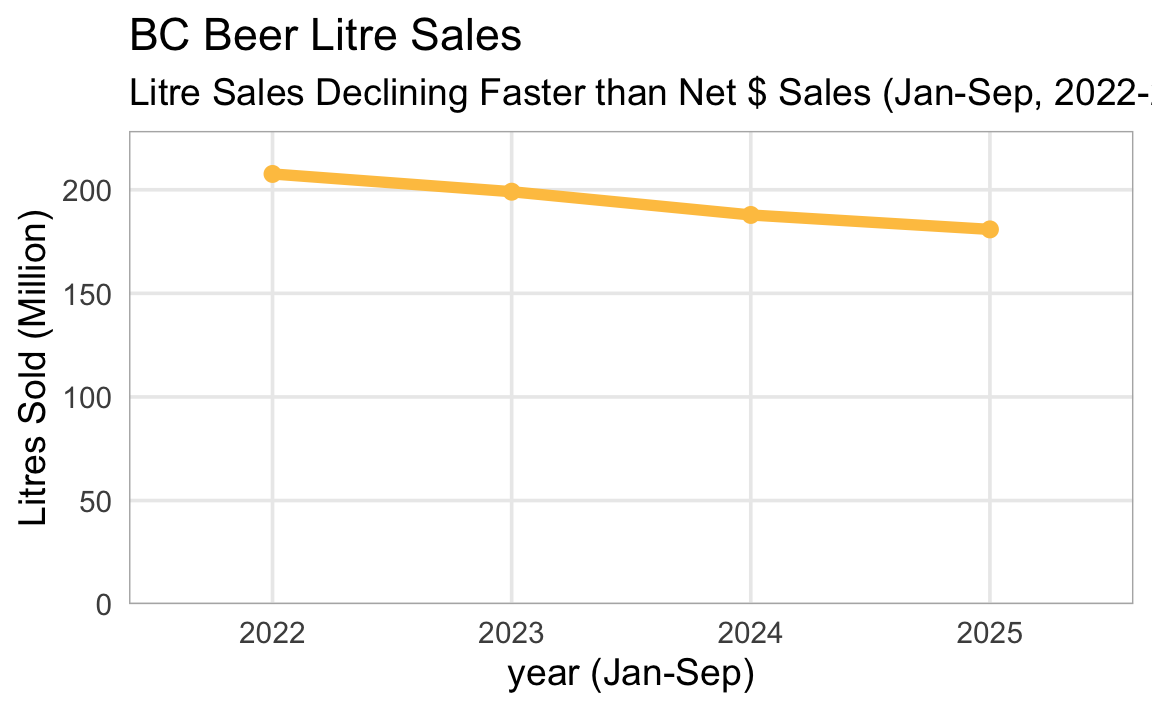
Volume is Falling Faster than Revenue
Even more prominent is the downward trend in litres sold, indicating declines in net $ sales are somewhat offset by rising prices.
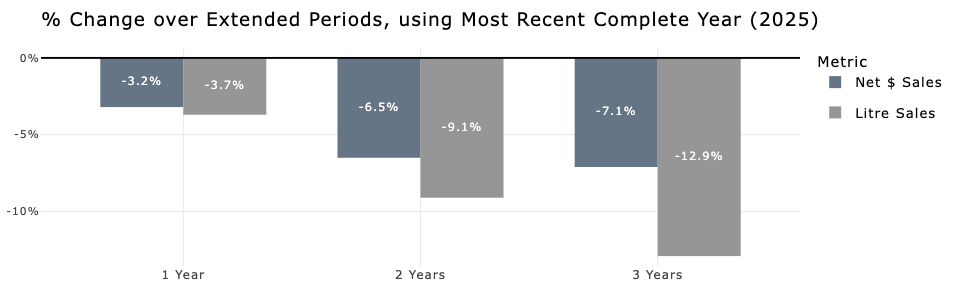
The decrease in 2025 vs 2024 (comparing first 9 mths) is -3.2% for net $ sales and -3.7% for litre sales. These losses have been added up, to the point where net $ sales are down -7% and litre sales down -13% in 2025 vs 2022 (first 9 mths of each).
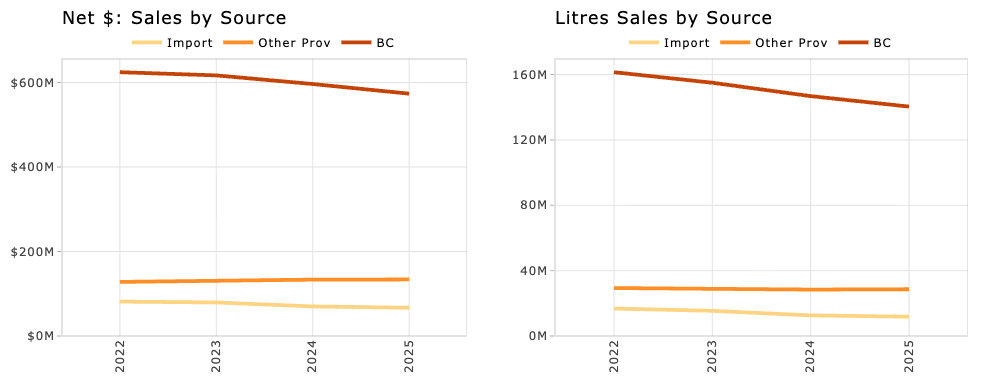
BC-produced Beer Accounts for Most of the Decline
Most of the beer sold in BC is produced in BC (~75%), and BC-produced beer is where the largest decline has occurred. Imports have also been trending down, while beer from other provinces has been steady, even with small increases.
2025 Shows a Slower Rate of Decline than 2024
One possible silver lining for the industry is that declines in sales - both net $ and litres - were steeper in 2024 compared to 2023 than in 2025 compared to 2024, again for the first 9 months of each year.
Here’s a breakdown in YoY changes, with actual numbers in tables below:
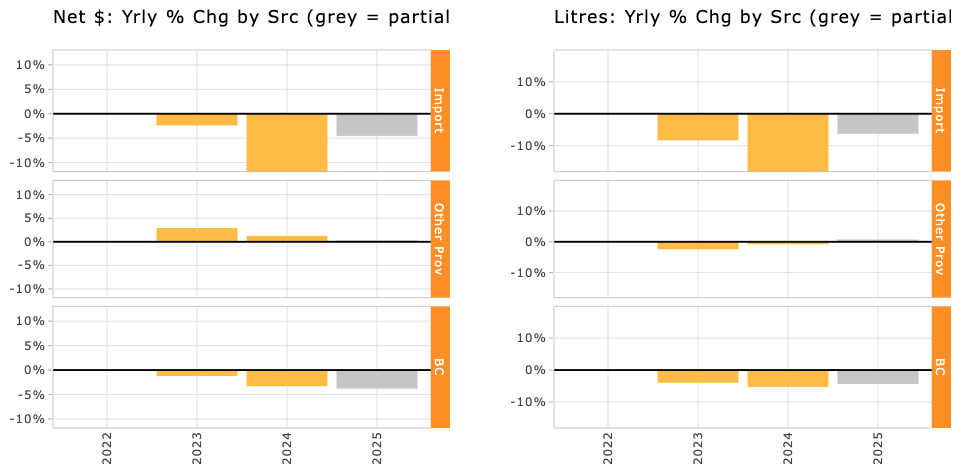
| Net $ Sales: YoY Change by Category | |||
|---|---|---|---|
| First 9 months, 2023-2025 | |||
| 2023 | 2024 | 2025 | |
| BC | −1.2% | −3.3% | −3.8% |
| Import | −2.4% | −11.9% | −4.5% |
| Other Prov | 2.9% | 1.2% | 0.3% |
| Litres: YoY Change by Category | |||
|---|---|---|---|
| First 9 months, 2023-2025 | |||
| 2023 | 2024 | 2025 | |
| BC | −4.0% | −5.3% | −4.4% |
| Import | −8.3% | −18.1% | −6.3% |
| Other Prov | −2.4% | −0.8% | 0.7% |
So What? The Take-aways & Implications
At a high level, BC beer sales data points to a market that is contracting gradually but persistently rather than experiencing a short-term disruption. While there are limits to what can be inferred from aggregated sales data alone, several conclusions stand out.
What the data shows
- Beer consumption in BC continues to decline, aligning with broader shifts in alcohol consumption patterns.
- Volume declines are larger than declines in dollar sales, indicating that price increases have partially offset falling consumption, but not enough to reverse the trend.
- The overall downturn is driven primarily by BC-produced beer, reflecting both its dominant market share and weakening demand.
What this means for industry participants
- Continued declines present challenges for:
- Investors evaluating brewery expansion or acquisition opportunities
- Brewers, bars, restaurants, and liquor retailers seeking growth from beer sales
- The slower rate of decline in 2025 compared to 2024 may suggest stabilization, but the data does not yet support a clear rebound.
Open questions looking ahead
- Is the beer market approaching a floor, or will declines continue at a reduced pace?
- As interprovincial trade barriers are reconsidered, could increased access for out-of-province beer further pressure BC producers — or create new opportunities for export beyond BC? Or both?
Up Next: Trends in BC Producer Categories
In a follow-up post, I’ll drill into recent trends for the BC producer categories to see what additional insights the data holds:
- BC major breweries, regional breweries, ‘micro’ breweries (the BC LDB term for craft brewers)
More info on BC Beer Sales…
As always, for more info, check out the full suite of BC Sales Stats dashboards available on this site.