BC Beer Sales Continue to Decline: -3% in 2025 vs 2024
Data to Dec 31, 2025 from BC Liquor Distribution shows litre sales of beer down 3% year-over-year, net $ sales down 2.4%.
- to be addedd at end
Latest data published by the BC Liquor Distribution Board in its December 31, 2025 quarterly Liquor Market Review shows continuing trend of declining beer sales in BC.
Data is published on a quarterly basis, but using aggregated data in interactive dashboards on BCBeer.ca we can see longer-term, annualized trends.
[maybe redundant? misplaced?] While the pace of decline has moderated somewhat compared to 2024, the overall direction remains negative. The data highlights three key dynamics: a steady multi-year decline in beer sales overall, even sharper reductions in volume than in dollar value (being offset by rising prices), and disproportionate role of declines in BC-produced beer, which accounts for the majority of beer sold in the province.
Steady Multi-Year Decline in BC Beer Sales
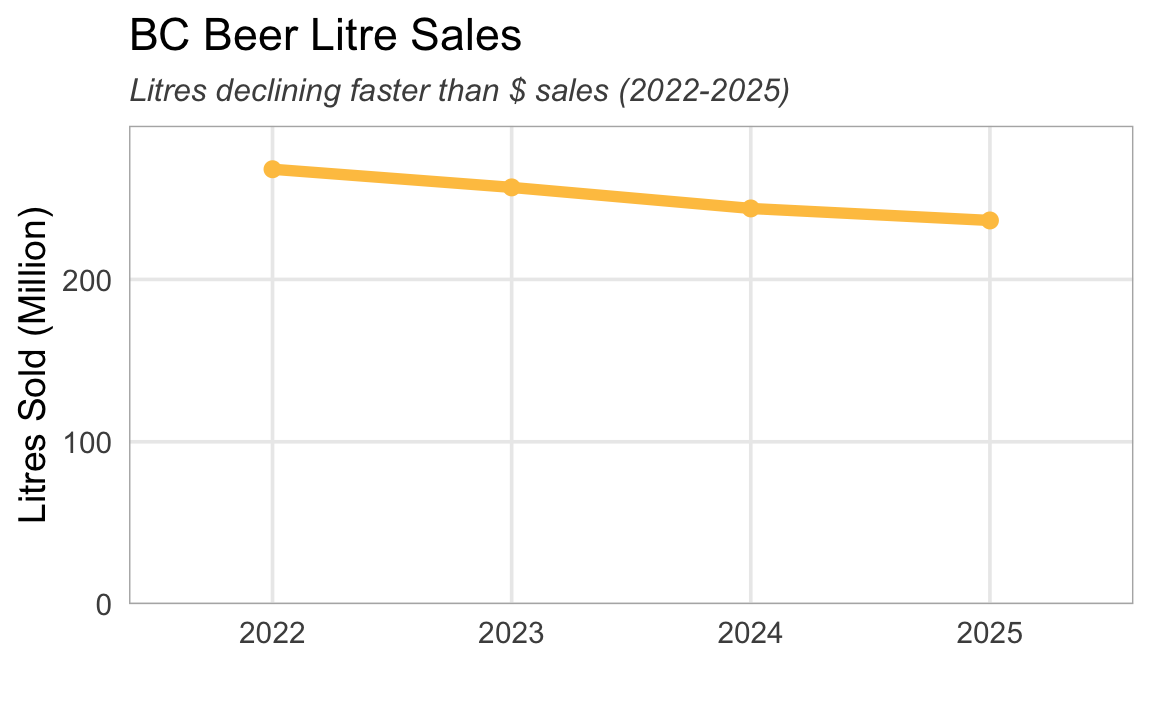
Beer sales in BC have been in long-term decline (especially in litres sold) and the trend has picked up since 2022.
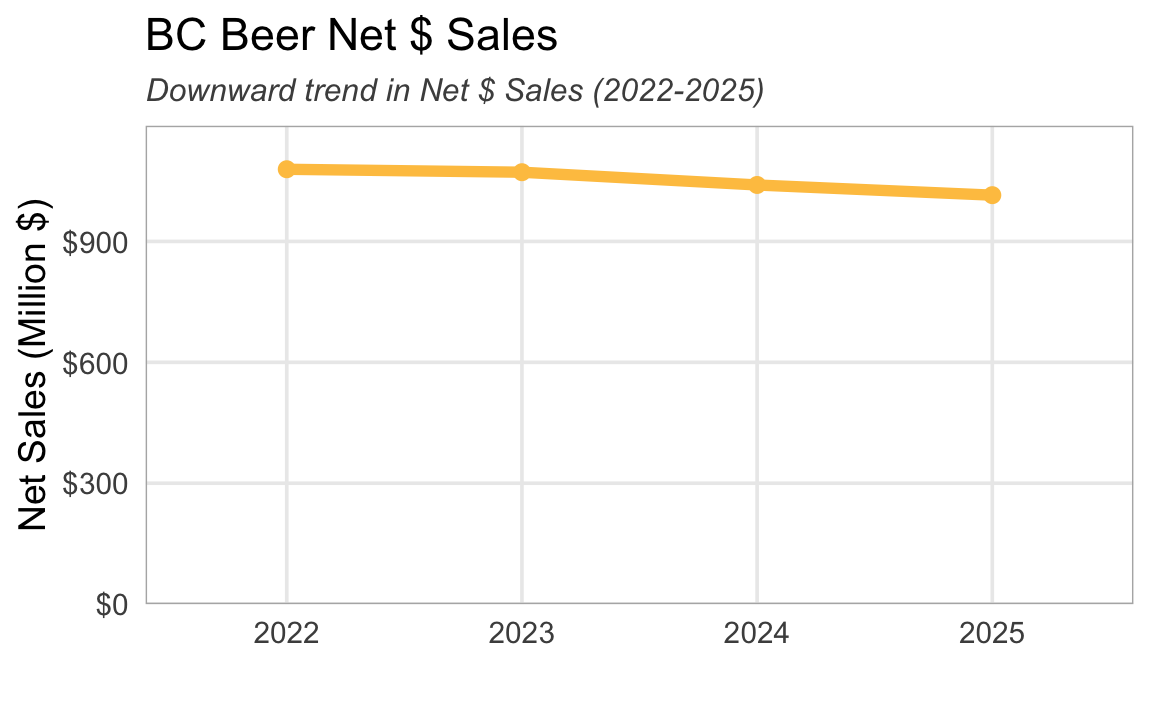
Source: BCBeer.ca > Overview; original data from BC LDB quarterly Liquor Market Reviews
Annual data makes it clear that, while not dramatic, full‑year 2025 beer sales continued to soften, with net sales down 2.4% and litres down 3.0% year over year. BC beer remains the dominant category (about 78% of litres), and its decline is the main drag on the market, while imports contracted even faster on a percentage basis.
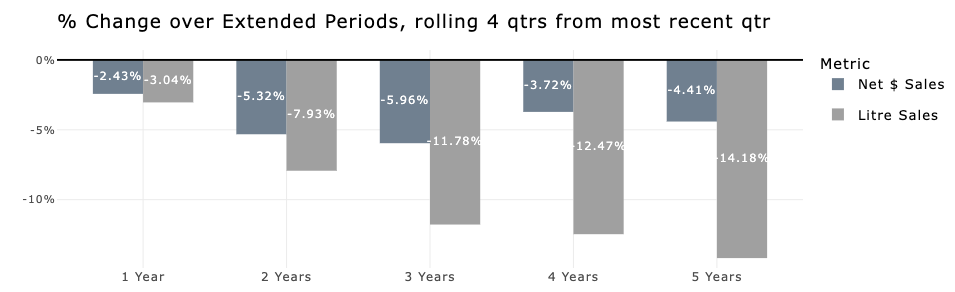
The decline is even more pronounced when looked at compounding over longer period:
- 14% decline in litre sales over the last 5 years highlighting downward consumption trends.
- 4% decline in net $ sales over the last 5 years, as price increases have served to somewhat offset the volume decline.
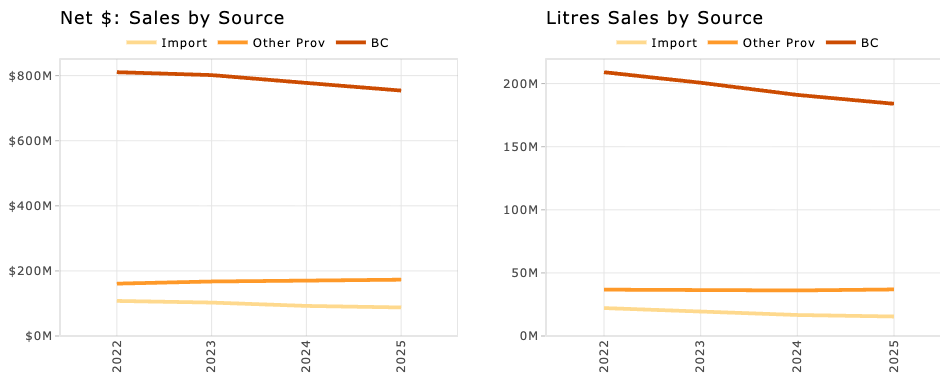
BC-produced Beer Accounts for Most of the Decline
Most of the beer sold in BC is produced in BC (~75%), and BC-produced beer is where the largest decline has occurred. Imports have also been trending down, while beer from other provinces has been steady, even with small increases.
Year-over-year percentage change by beer source highlights some interesting trends:
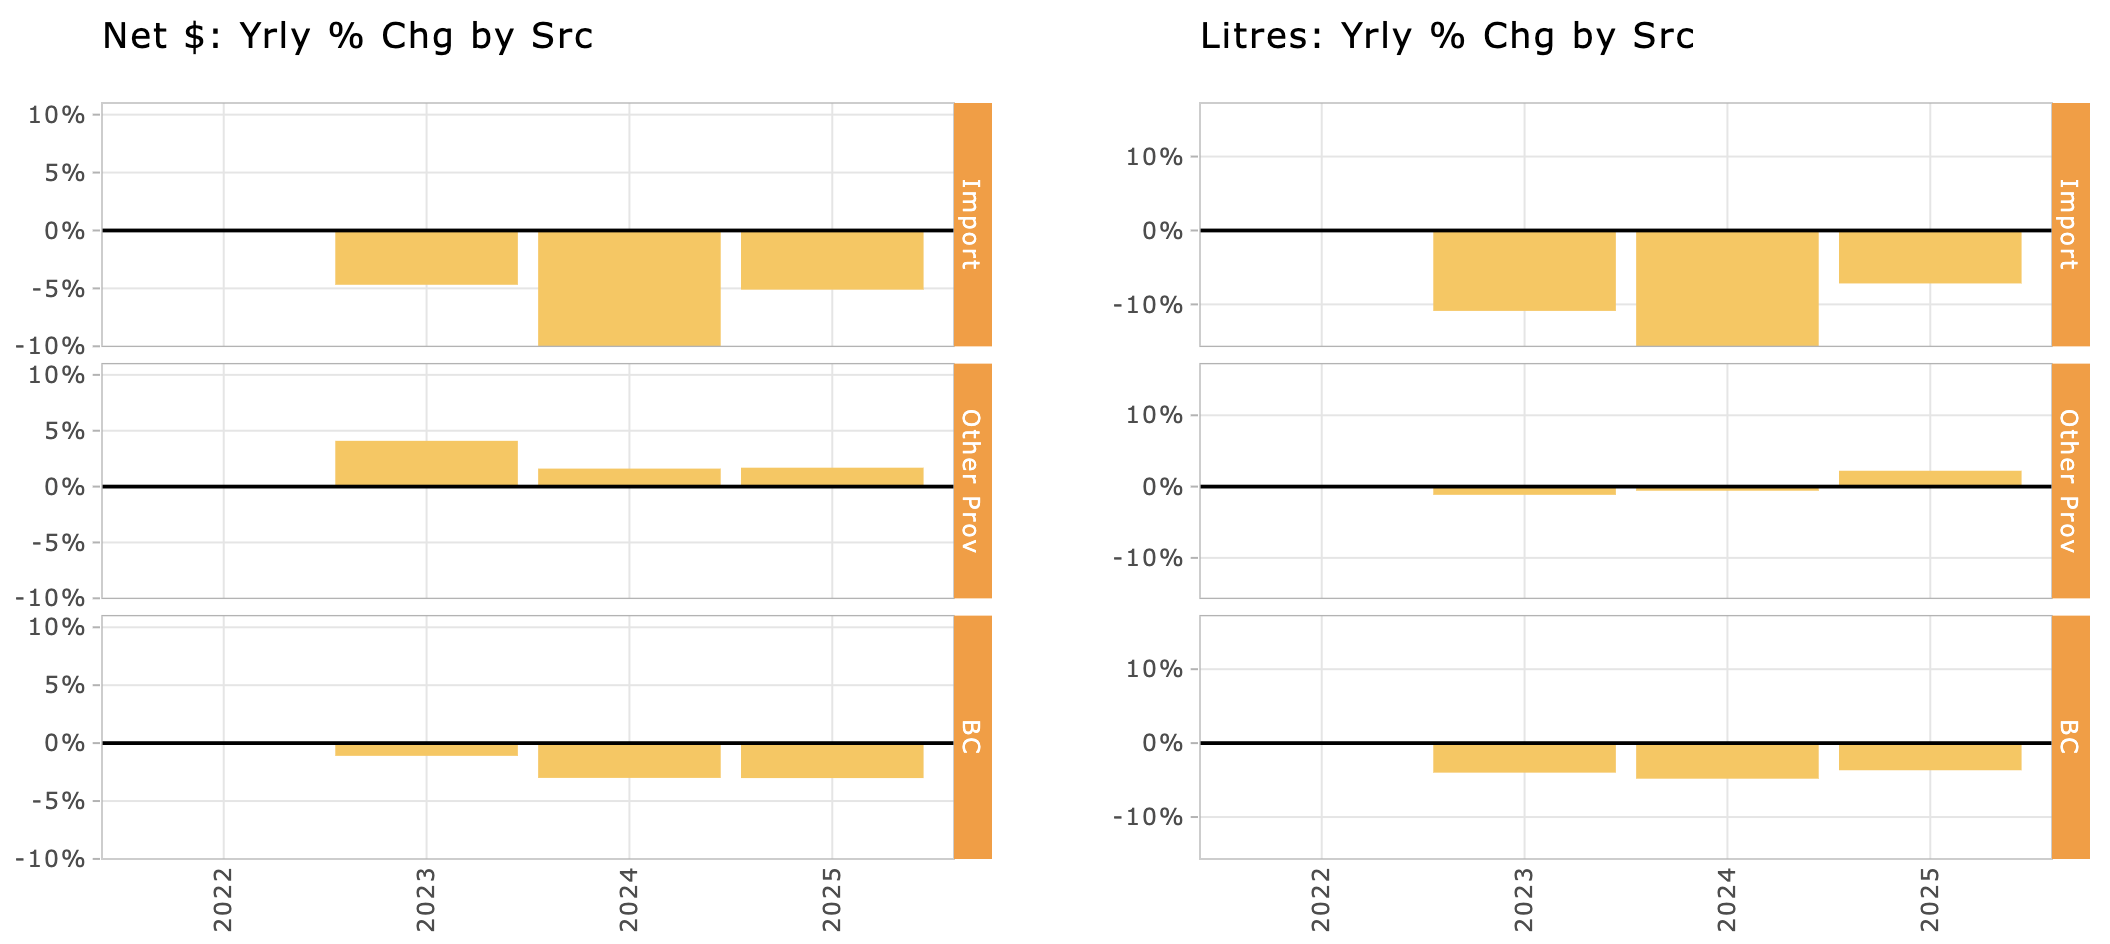
- While BC produced beer accounts for largest absolute drop in sales, Imports have the largest percentage drop with 7% drop in litres year-over-year, 5% drop in net $ sales.
- The only positive category is beer from other provinces, which posted modest growth. This could be a result of lowered barriers to inter-provincial trade, although the category has had slow growth over the past few years.
- Percentage declines peaked in 2024 compared to 2023, so there may be some stabilization ahead.
Summary of Year-over-Year Changes
As previously noted, declines in both net $ and litres maxed out in 2024 (except other province beer).
Here’s a breakdown in YoY changes by category:
| Net $ Sales: YoY Chg by Category | ||||
|---|---|---|---|---|
| 2022-2025 | ||||
| 2022 | 2023 | 2024 | 2025 | |
| BC | $16.7M | −$8.9M | −$24.1M | −$23.5M |
| Import | $5.4M | −$5.1M | −$10.3M | −$4.7M |
| Other Prov | $3.0M | $6.6M | $2.7M | $2.9M |
| Litre Sales: YoY Chg by Category | ||||
|---|---|---|---|---|
| 2022-2025 | ||||
| 2022 | 2023 | 2024 | 2025 | |
| BC | −1.3M | −8.4M | −9.7M | −7.0M |
| Import | −349.0K | −2.4M | −3.1M | −1.2M |
| Other Prov | −492.7K | −424.2K | −210.5K | 801.3K |
| Net $ Sales: YoY % Chg by Category | ||||
|---|---|---|---|---|
| 2022-2025 | ||||
| 2022 | 2023 | 2024 | 2025 | |
| BC | 2.1% | −1.1% | −3.0% | −3.0% |
| Import | 5.3% | −4.7% | −10.0% | −5.1% |
| Other Prov | 1.9% | 4.1% | 1.6% | 1.7% |
| Litre Sales: YoY % Chg by Category | ||||
|---|---|---|---|---|
| 2022-2025 | ||||
| 2022 | 2023 | 2024 | 2025 | |
| BC | −0.6% | −4.0% | −4.8% | −3.7% |
| Import | −1.6% | −10.9% | −15.7% | −7.2% |
| Other Prov | −1.3% | −1.2% | −0.6% | 2.2% |
Source: BCBeer.ca > Overview > Net $ Beer Sales & Litres by Source; original data from BC LDB quarterly Liquor Market Review.
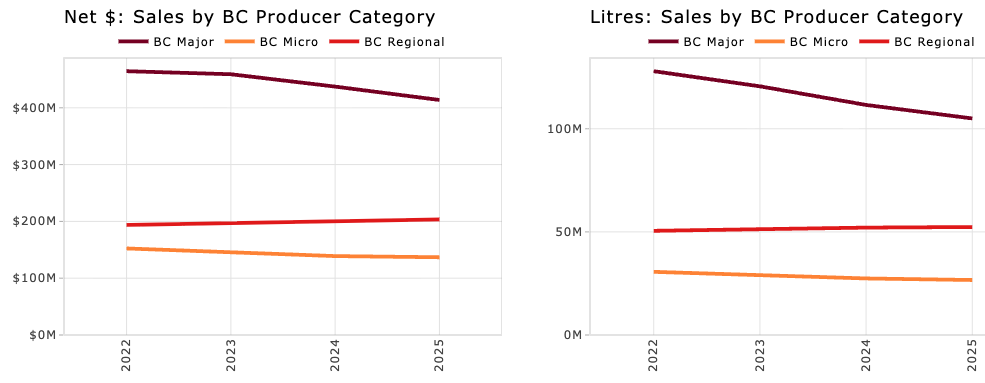
BC Brewer Trends: Major Breweries Driving Decline
When it comes to changing beer habits and declining sales, the most prominent trend is moving away from major producers. BC ‘micro’ breweries (the BC LDB designation for craft brewers) are also declining, but at a slower rate. In the middle, the ’regional’ breweries have actually seen slight growth in recent years, although appears to be slowing.
These trends are more evident when looking at percentage changes year-over-year:
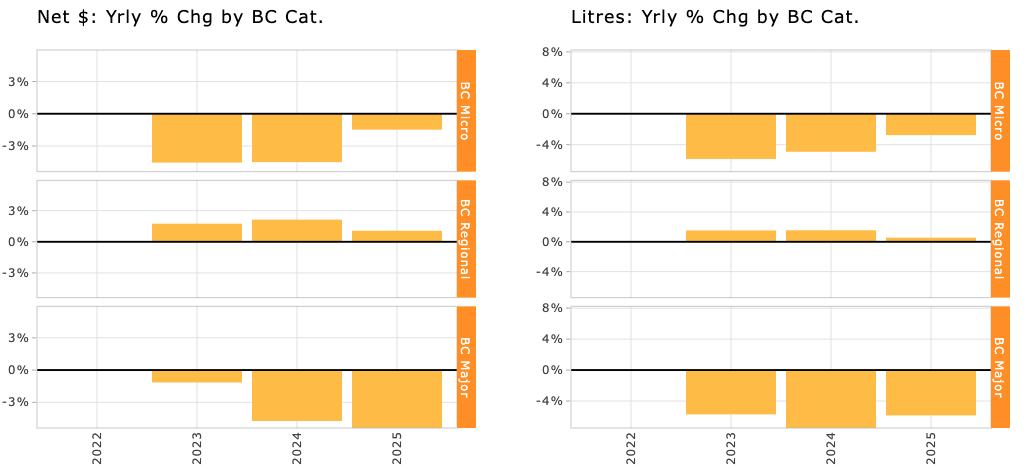
- BC major breweries: -6% decline in litres; -5% decline in net $ sales.
- BC regional breweries: +0.6% in litres; +1% in net $ sales.
- BC micro breweries: -3% in litres; -1.5% in net sales.
Take-aways & Implications
- downward trends in beer consumption and spending in BC continue, with sales reaching multi-year lows in 2025.
- BC producers remain dominant, although seeing the largest declines.
- Imports declining at even faster rate than BC producers.
- Beer from other provinces actually growing slightly.
- Among BC producer categories used by BC LDB:
- downward sales trends are driven by consumers moving away from major brewery products.
- regional breweries continuing to show slow growth year-over-year in 2025.
- micro-breweries trending down, although at slower rate in 2025 compared to previous years.
More info on BC Beer Sales…
As always, for more info, check out the full suite of BC Sales Stats dashboards available at BCBeer.ca. Data going back to 2016, aggregated by annual and quarterly periods.